Steelers stats through Week 10 border the bizarre and unusual
The Pittsburgh Steelers have looked a little different through ten weeks of play in the 2017 NFL regular season than anticipated. In this look at some of the offensive stats, the numbers show both a bizarre and unusual trend for several players as the team sits at 7-2 entering their Thursday Night Football meeting with the Tennessee Titans at Heinz Field.
Le’Veon Bell’s struggles
Bell is 28th in the league in rushing average per attempt. 54 players have longer rushes on the season than Bell’s longest run of 27 yards.
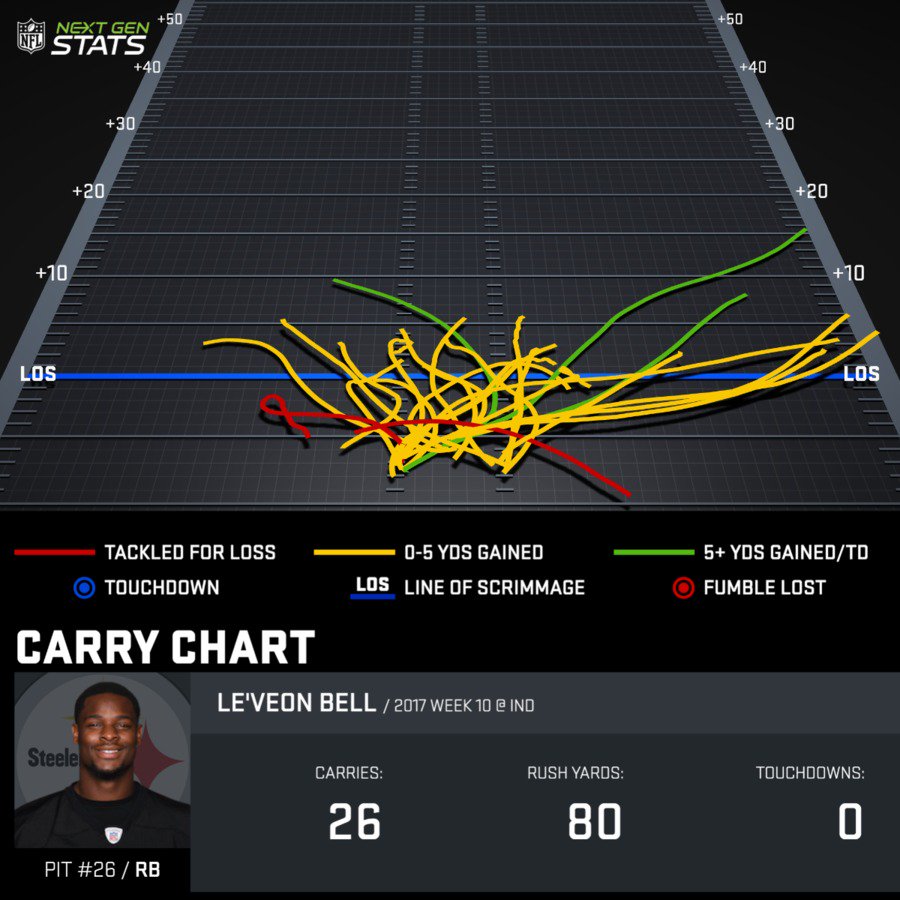
Le’Veon Bell had just 1 rush ( on 26 attempts) that went for 10+ yards against the Colts. 21 of 26 rushes went under 5 yards. Bell is averaging 3.3 yards per carry over his last 3 games. 3.8 on the season.
JuJu Smith-Schuster
JuJu Smith-Schuster’s average statistics over last three games: 4.7 REC, 6.7 TAR, 23.5 YPC, 109.7 YDS/GM, 1 TD/GM
Crazy to think that there was a full generation between JuJu Smith-Schuster and Adam Vinatieri playing in the same game (nearly a 24 year age difference). #Steelers #SteelersNation https://t.co/Ur6BGn4oO3
— Tommy Jaggi (@TommyJaggi) November 13, 2017
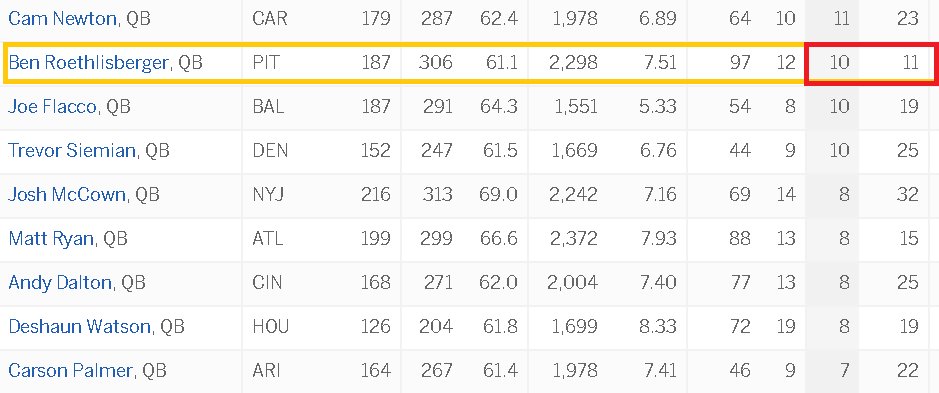
Ben Roethlisberger’s struggles

Ben Roethlisberger’s passer rating deep down the sidelines tells you all you need to know about the Steelers deep passing game this year. He has not been good in that department.
47.5 passer rating on 20+ yard passes. 23.3 passer rating on 20+ outside the hashes.
Through week 10, Ben Roethlisberger currently sits at 24th in the NFL in passer rating (83.8)
Passer ratings down. Way down.
Jared Goff + Carson Wentz = 39 TD, 9 INT, 102.8 avg. passer rating.
Ben Roethlisberger + Joe Flacco = 20 TD, 20 INT, 78.2 avg. passer rating.
Preserving Roethlisberger
Ben Roethlisberger has been sacked less (11) this season than Houston Texans QB Tom Savage (12)…
Savage has played in 3 games.
However, Ben is on an unusual pace
Ben Roethlisberger is almost on pace for something very unusual: to have more INT than sacks taken this season.
Antonio Brown’s off year
Antonio Brown is catching just 59.4% of targets this year – his lowest in 5 years. His last 3 games:
- 3 of 7 for 47 yards
- 5 of 10 for 70 yards
- 4 of 10 for 65 yards
Catch rates in previous four years:
- 2016 – 68.4%
- 2015 – 69.7%
- 2014 – 70.9%
- 2013 – 66.7%
As you can see, what translates on the field as a struggling Steelers offense – at times – does show up on the stats sheet. Some of the trends border the bizarre for a team that has a winning record, however.